When /actuator/health stays UP while log ingestion blocks on Kafka
log0's first real POST to the ingestion gateway hung for about 60 seconds while every liveness check returned 200. The failure was a Kafka producer blocking on max.block.ms against an unreachable broker address.

Full-stack Software Engineer - (Builder of log0)
 Commune
This is post 1 in a series on building log0, a multi-tenant incident-management platform. It covers the first real bug, the producer behavior behind it, and why a green dashboard can confirm a service is running while it cannot do its job.
A green dashboard and a request that never returned
The stack was built. Seven services, a Redpanda broker, ClickHouse, PostgreSQL, all wired into one Docker Compose file. I brought it up, watched the health checks go green one by one, and it looked done. docker compose ps showed every service up. Each /actuator/health endpoint returned 200. Spring Boot Actuator was happy. The logs showed clean startup, no exceptions, every consumer subscribed to its topic.
Then I sent the first real log line. A single POST /api/v1/logs to the ingestion-gateway, the front door of the whole system.
It hung. No 202, no error, no timeout for a long time. The connection sat open. The gateway had accepted the TCP connection, read the request, and then stopped, holding the line, returning nothing.
Nothing in the logs explained it. The gateway was not crashing and not throwing. CPU was near zero. By every signal I had been watching, the service was healthy. It was also doing nothing, and had been from the start.
What the health check was checking
Here is the thing I had not internalized until this moment: a liveness probe and a real request take two completely different paths through the service.
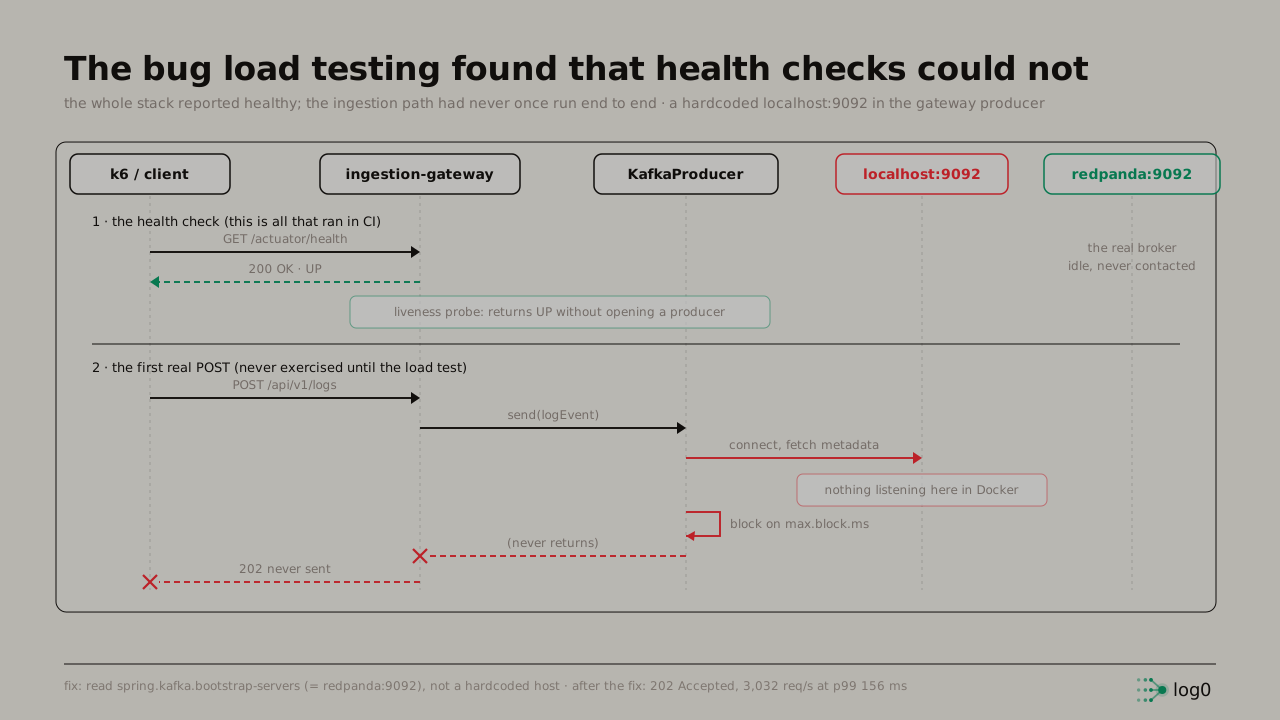 The health check returns UP without opening a Kafka producer, while the first real POST sends to a hardcoded localhost:9092, finds no broker in the container, and blocks on max.block.ms
The top half of that diagram is what ran in CI and what I had been watching: GET /actuator/health hits the gateway, the gateway answers 200 OK (UP), done. That probe never touches Kafka. It does not open a producer, it does not fetch metadata, it does not send anything. It confirms exactly one thing: the JVM is running and the HTTP server is accepting connections. That is all "healthy" ever meant.
The bottom half is the first real request, the one that had never run before that moment. POST /api/v1/logs reaches the gateway, the gateway builds a KafkaProducer and calls send(), and the producer tries to connect to a broker and fetch cluster metadata before it can produce. That is where it died, and it died on a connection that the health check had no reason to ever attempt.
The two paths share almost no code. The probe was green because the probe path worked. The probe path working told me nothing at all about whether the producer path worked, and I had quietly assumed it did.
What triggered it: one hardcoded address
The producer was configured like this, in the gateway's KafkaProducerConfig:
@Bean
public ProducerFactory<String, RawLogEvent> rawLogProducerFactory() {
    Map<String, Object> props = new HashMap<>();
    props.put(ProducerConfig.BOOTSTRAP_SERVERS_CONFIG, "localhost:9092");
    // ...
    return new DefaultKafkaProducerFactory<>(props);
}
// the raw-logs-dlq factory carried the same hardcoded literallocalhost:9092. Hardcoded.
On my host machine, during early single-process testing, localhost:9092 is exactly where the broker was, so this had worked once, on the host, outside Docker. Inside the container it is a lie. Each container has its own network namespace. From inside the ingestion-gateway container, localhost is the gateway container itself, where nothing is listening on 9092. The real broker is a different container, reachable on the Compose network as redpanda:9092.
So when the producer called send(), it tried to open a connection to localhost:9092 inside its own container, found nothing listening, and began doing what a Kafka producer is designed to do when it cannot reach a broker: it blocked, waiting for cluster metadata, up to max.block.ms.
Why it blocked instead of failing
This is the part worth slowing down on, because the failure mode is counterintuitive.
A Kafka producer does not fail fast when the broker is unreachable. By design, send() first needs cluster metadata: which partitions exist, which broker leads each one. Until it has that metadata, it cannot decide where the record goes, so it waits. The wait is bounded by max.block.ms, which defaults to 60 seconds.
So the producer was not broken in the sense of throwing. It was patiently doing its job: trying to reach a broker, retrying the connection, waiting for metadata that was never going to arrive because nothing was listening at that address. The calling thread, the one handling my HTTP request, was parked inside send() for the full block duration. From the client's side, the request hung.
There was no exception to find in the logs because, for those 60 seconds, nothing exceptional had happened yet. The producer was inside its normal "broker not available, keep trying" loop. The redpanda broker, the real one, sat idle the whole time, never contacted, because no code in the running system knew its address.
The entire ingestion path, the front door of the product, was non-functional in Docker, and had only ever been health-checked, never exercised end to end. The green dashboard was accurate and misleading at the same time: accurate about the process, silent about the job.
The fix
The fix is small, which is the uncomfortable part. The address should never have been a literal. It should come from configuration, so it can differ between the host and the container without a code change:
@Configuration
public class KafkaProducerConfig {

    @Value("${spring.kafka.bootstrap-servers:localhost:9092}")
    private String bootstrapServers;

    @Bean
    public ProducerFactory<String, RawLogEvent> rawLogProducerFactory() {
        Map<String, Object> props = new HashMap<>();
        props.put(ProducerConfig.BOOTSTRAP_SERVERS_CONFIG, bootstrapServers);
        // ...
        return new DefaultKafkaProducerFactory<>(props);
    }
}
And in the Compose environment for the gateway:
environment:
  SPRING_APPLICATION_JSON: '{"spring.kafka.bootstrap-servers":"redpanda:9092"}'
One value, read from the environment, resolving to redpanda:9092 inside the network. On the host, the same property defaults to localhost:9092. Same code, correct address in both places.
After the fix, the first POST /api/v1/logs returned 202 Accepted right away. The producer connected to redpanda:9092, fetched metadata in milliseconds, wrote the event to raw-logs, and acknowledged. The path that had never worked now worked, and from there it kept working: with the address right, the gateway sustained 3,032 requests per second in a 60-second load test, 181,995 requests total, at p99 156 ms and a p50 near 26 ms. The endpoint was never slow. It had been blocked on an address that resolved to nowhere.
The lesson
The trigger was mundane: a hardcoded host that resolved correctly outside Docker and pointed nowhere inside it. The lesson under it generalizes well past this one bug, and it is the reason this is post 1.
A health check that does not exercise the real path is a check that the process started, nothing more. My liveness probe answered "is the JVM up and serving HTTP," and I had been reading it as "does ingestion work." Those are different questions with different answers, and the gap between them is exactly where this bug lived for as long as it did. The probe was not wrong. It was answering the question it was designed to answer. I was the one asking it to mean more than it did.
The honest version of "healthy" for an ingestion service would touch the thing that can break: a readiness probe that confirms the producer can reach a broker, or, more bluntly, a smoke test that sends one real event end to end and checks an incident comes out the far side. The cheapest possible version of that, a single real POST in CI, would have caught this in seconds. I had not written it, because everything was green and green felt like enough.
This is also a quiet argument for load testing earlier than feels necessary. I did not find this bug by reasoning about my config. I found it the instant I sent real traffic. The load test was not measuring throughput yet; it surfaced a correctness bug first, because it was the first thing to ever exercise the path for real. Synthetic load is not only about performance numbers. Often the first thing it tells you is whether the system does anything at all.
What is not done
To keep the scope honest, in the spirit of the rest of this series:
- The gateway has a basic liveness probe and now reads its broker address from config, but it still does not ship a readiness probe that verifies broker reachability. It should. That is the real fix for the class of bug, not only this instance.
- There is no automated end-to-end smoke test wired into the build yet. The manual "send one event, watch an incident appear" check is documented, not automated.
- These numbers are from a single-node setup on one laptop, the same scope disclaimer as everywhere in this series: Docker Desktop, 512 MB per service, a single Redpanda node, driven by k6. They characterize the path's behavior, not production capacity.
Next: post 2, the fingerprint. Once a log line reaches the system, how does log0 decide that 115,489 lines are the same bug and one line is a different one, deterministically, with no machine learning, in O(1) per event? It comes down to what you strip out before you hash.
Try log0
log0 is the platform this series is built on, an open, multi-tenant incident pipeline you can run yourself or use hosted.
- Platform: log0.in
- Docs: log0.in/docs
- Console: console.log0.in
- charfield, the ASCII animation registry behind the log0 front ends: charfield.log0.in
Written by Ashmit JaiSarita Gupta. Find me on LinkedIn, GitHub, and X, and read the rest of the series on Hashnode.