Overview: log0's multi-tenant incident pipeline on Kafka
Series map for log0: HTTP log ingest, fingerprint deduplication, windowed clustering, incident lifecycle, and Slack notification across seven Spring Boot services-with load-test figures from a single-laptop deployment.

Full-stack Software Engineer - (Builder of log0)
 Commune
A bad deploy at 3 AM
A deploy ships at 02:50. One null check is missing on a hot path. By 03:00 the payment service has thrown the same NullPointerException tens of thousands of times. If your alerting forwards each line as its own page, the on-call engineer's phone has now buzzed tens of thousands of times for a single bug.
The bug is one thing. The error is one thing. The log stream does not know that, so it emits one line per occurrence, and a naive alerting layer turns each line into a page. The signal, one bug, drowns in the volume, ten thousand lines.
In a load test that reproduced exactly this shape, log0 ingested 115,489 log lines carrying one error pattern and created exactly one incident. A deduplication ratio of 115,489 to 1. Same run, ten distinct error patterns going in: ten incidents out. One page per real problem, regardless of volume.
That collapse, from a flood of lines to a single owned incident, is the entire product. This post is the map of how it happens: the services, the data flow, the handful of decisions that shaped it, and the real numbers from load-testing the whole thing on one laptop. Every later post in this series drills into one box on the diagram below.
What log0 is
log0 is a multi-tenant incident-management platform for backend teams. Your services POST their logs to it over HTTP. From there it:
- deduplicates errors by a structural fingerprint, so 10,000 occurrences of one bug are one thing;
- clusters those fingerprints in time windows and opens an incident when a pattern crosses an occurrence threshold;
- drives each incident through a lifecycle (new, assigned, acknowledged, resolved);
- notifies the on-call Slack channel, with an AI-written root-cause summary attached;
- keeps every tenant's data structurally isolated the whole way through.
The functional requirements are the obvious ones: ingest logs, group similar errors, detect incidents at a threshold, manage their lifecycle, notify a channel, and summarize. The non-functional ones are where the design lives: accept a log in single-digit milliseconds, never let ingestion go down because something downstream is slow, tolerate eventual consistency on detection, and isolate tenants by construction rather than by a WHERE clause that is easy to forget.
It is seven Java / Spring Boot services talking over a Kafka API, with ClickHouse for logs and PostgreSQL for incident state. It runs as one Docker stack. Nothing here is at the Meta scale, and I will be specific later about exactly what the numbers are and are not.
The shape: one stream, one direction
log0 is not a web of services calling each other. It is a single linear stream. A log event enters at one end and moves in one direction, and each hop between services is a Kafka topic, not a synchronous call.
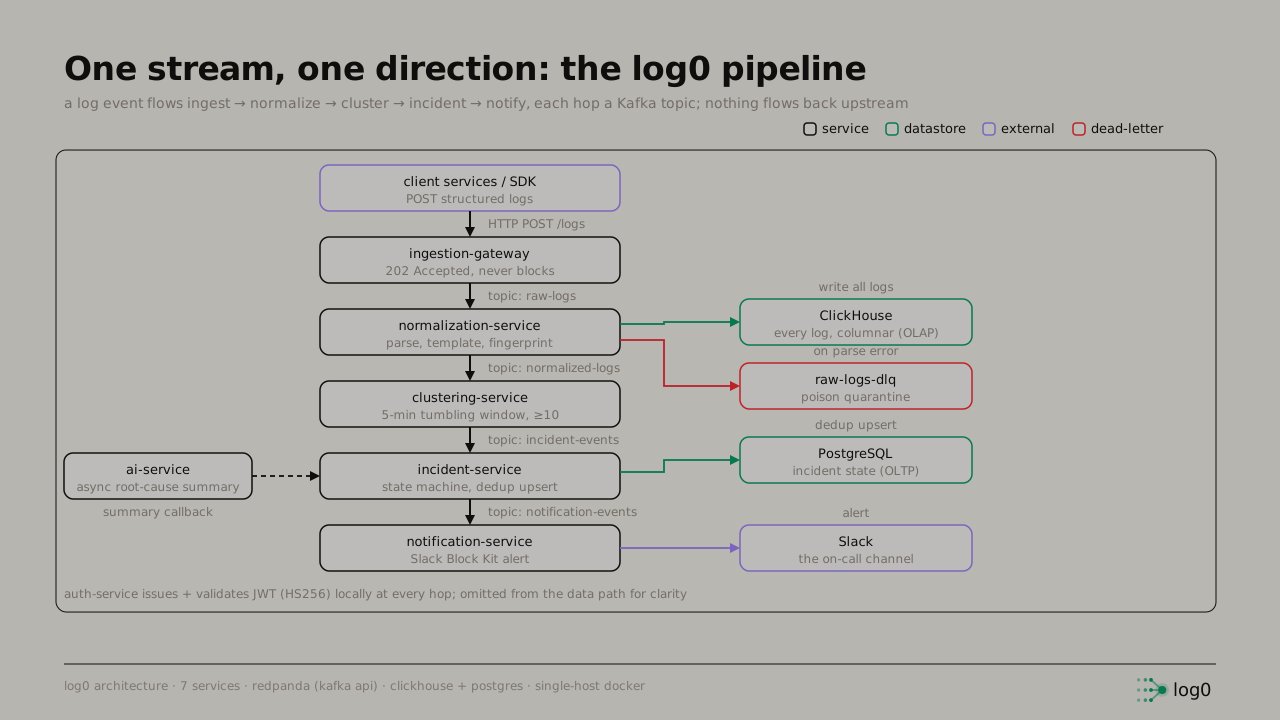 log0 architecture: a one-directional stream from ingestion to notification, each hop a Kafka topic, with ClickHouse, PostgreSQL, the dead-letter queue and ai-service branching off
Read top to bottom, that is the entire data path:
- ingestion-gateway takes the HTTP POST, does the minimum validation, writes the event to the
raw-logstopic, and returns202 Accepted. It never waits for processing. That single decision is the subject of post 4 in this series, Accept fast, never block. - normalization-service consumes
raw-logs, parses each event into a stable shape, strips the dynamic values out of the message to build a template, computes the fingerprint, writes the full event to ClickHouse, and emits tonormalized-logs. The fingerprint is discussed in post 2 in this series. - clustering-service consumes
normalized-logsand counts occurrences per fingerprint inside a 5-minute tumbling window. When a window crosses 10 occurrences, it emits oneincident-eventsmessage. Streaming aggregation is discussed in post 3 in this series. - incident-service consumes
incident-events, runs the incident through its state machine, and upserts it into PostgreSQL. Because the same event can arrive more than once, every write is idempotent. That is covered in post 10 in this series. - notification-service consumes
notification-eventsand posts a Slack Block Kit alert to the owning team. - ai-service attaches a root-cause summary out of band, via an async callback, so a slow model never blocks the alert.
Two things never flow backwards, and that is the point. Nothing downstream can apply backpressure to the gateway by making it wait, and a single poison message cannot freeze the pipeline, because normalization routes anything it cannot parse to a dead-letter topic, raw-logs-dlq, instead of dying on it.
auth-service sits outside the data path: it issues JSON Web Tokens and every other service validates them locally, with no network call back to auth on the hot path. Login versus API-key validation throughput is measured in post 8 in this series.
Five decisions that shaped everything
log0 came down to a small number of decisions, each with a cost. The series is organized around them. Here they are, stated plainly, each with the tradeoff it carries.
1. Accept fast, never block. The ingestion endpoint returns 202 Accepted the moment the event is durably on the raw-logs topic. It does no clustering, no database write, and no enrichment inline. The cost: the caller gets an acknowledgement, not a result. Detection is eventually consistent, seconds behind. For a logging endpoint that must never be the thing that is down, that is the correct trade.
2. A log line is an event with an identity. Deduplication is not string matching. log0 strips the dynamic values out of a message (numbers, IP addresses, UUIDs become placeholders), joins four stable fields with a pipe, and hashes them:
fingerprint = SHA-256( service | messageTemplate | exceptionType | firstStackFrame )Same bug, different timeout value or request ID: same fingerprint, same incident. The cost is that a log format the templating regexes do not recognize will under-deduplicate. The failure mode is benign, it makes too many incidents (noisy but visible), never too few (a hidden, merged bug). We have discussed this in post 2 of this series.
3. Multi-tenancy is a partition key, not a column. Events are keyed by tenantId on the Kafka topics, which buys per-tenant ordering and noisy-neighbor isolation for free, and every stored row carries tenant_id. Isolation is structural. The cost is partition skew when one tenant is far louder than the rest. As discussed in Post 8 of this series, I measured the skew rather than asserting it away.
4. At-least-once delivery, plus idempotency. Kafka redelivers on a consumer rebalance or a retry, so the same incident-events message can arrive twice. Rather than fight that, every incident write is an idempotent upsert keyed on (tenant, fingerprint): a duplicate increments the occurrence count, it never forks a second incident. At-least-once plus idempotent equals effectively-once. We have discussed this in post 10 of this series.
5. Two databases, on purpose. Logs go to ClickHouse, a columnar store built for GROUP BY fingerprint over millions of rows. Incident state goes to PostgreSQL, which gives transactional updates and a clean state machine. One database cannot be great at both 10k-insert-per-second analytics and a transactional lifecycle. The cost is two systems to operate. We have discussed this in post 10 of this series.
The numbers, and exactly what they are
The reason to build the thing and then load-test it, rather than describe it, is that the interesting parts of a design only show up under load. Here are the headline results the series is built on. Each gets its own post with the full chart.
| Finding | Result |
|---|---|
| Deduplication ratio | 1 template in: 115,489 : 1. 10 templates: 8,760 : 1. 100 templates: 967 : 1. Incidents out always equalled templates in. |
| Single-row vs batched inserts | ClickHouse insert path went from 40 rows/sec at 171% CPU to 4,185 rows/sec at 15% CPU, one change. |
| Backlog drain | Single-row inserts built a 67,071-message backlog draining at ~68/sec; batched, the backlog peaked at ~283 and never sustained, clearing within ~15 seconds. |
| End-to-end detection | First error to incident row: p50 403 ms, p99 477 ms (n=60, same clock). |
| Concurrency sweep | 50 to 800 virtual users: throughput held in a ~1,600 to 2,200 req/sec band, p99 36 ms to 709 ms, under 0.4% errors, no collapse. |
| Tenant skew | A hot tenant at 9x the traffic of a quiet one: p99 80 ms vs 79 ms. The quiet tenant's tail did not move. |
| Dead-letter routing | 300 poison messages in: 300 to the DLQ, 0 dropped, clean path unaffected. |
| Broker under stress | Redpanda hit a real exit-137 OOM at 800 VUs while /actuator/health stayed 200. Topics survived; producers auto-reconnected. |
Scope, once and clearly. Every number above was measured on a single laptop: Docker Desktop, 512 MB per service, a single-node Redpanda broker, ClickHouse 24.3, driven by k6. These characterize the system's behavior and its bottlenecks, not its production capacity. A single-node broker that OOMs at 800 virtual users is not a scaling claim; it is a finding about where this configuration breaks, which is exactly the kind of thing the series is about.
The most useful results are the unflattering ones. The broker OOM while the health check stayed green is a small, honest "health checks lie" story. The single-row insert wall is a textbook producer/consumer mismatch you can watch build and then drain. Those are the posts I would read first.
What is not done
Stating the limits is part of the design, not an apology for it.
- The clustering window lives in process memory. A crash loses the in-flight windows. Production wants an external store (Redis) so the count survives a restart. It is designed, not yet built.
exceptionTypeis wired into the fingerprint formula but currently passed as null, a documented TODO. Until the normalizer parses the exception class out of the trace, two different exceptions thrown from the same line share a fingerprint. The slot exists; the wiring is half done.- Everything runs single-node. The share-nothing, partition-keyed design is meant to scale horizontally by adding consumers to a group, but I have not run it multi-node, so I will not draw you a scaling graph I cannot reproduce.
How to read this series
Each post takes one box on that diagram, or one of the five decisions, and goes deep: the problem, the naive version and why it broke (usually with a number), the fix, the real code, and the tradeoff. They stand alone, but they chain.
If you came for the algorithms, start with post 2, the fingerprint. If you came for the systems engineering, start with post 6, the day a one-line change took the insert path from 40 to 4,185 rows per second.
Next: post 1, the bug that load testing found and health checks never could. The whole stack reported healthy while the ingestion path had never once been exercised end to end. Here is how a green dashboard lied, and what it cost.
Try log0
log0 is the platform this series is built on, an open, multi-tenant incident pipeline you can run yourself or use hosted.
- Platform: log0.in
- Docs: log0.in/docs
- Console: console.log0.in
- charfield, the ASCII animation registry behind the log0 front ends: charfield.log0.in
Written by Ashmit JaiSarita Gupta. Find me on LinkedIn, GitHub, and X, and read the rest of the series on Hashnode.