Returning HTTP 202 after Kafka enqueue in the log ingestion gateway
log0's ingestion gateway responds with 202 Accepted once the log event is submitted to the Kafka producer, without waiting for broker acknowledgement, clustering, Postgres, or notification-measured with k6 from 50 to 800 virtual users.

Full-stack Software Engineer - (Builder of log0)
 Commune
A logging endpoint has one job it can never fail at: being available to accept logs. The fastest way to break that is to make the accept path wait on anything downstream. log0's ingestion gateway returns
202 Acceptedthe instant the event is handed to a Kafka producer future, before Kafka has even acknowledged it, and never waits for clustering, a database write, or a Slack call. Here is the code, why the response is sent exactly where it is, and what the latency looks like from 50 to 800 concurrent users.
This is post 4 in a series on building log0. Post 2 covered how a log line becomes a fingerprint and post 3 how those fingerprints cluster into an incident downstream. This one is about the decision that happens upstream of all of that, at the front door, and why it is the most important one in the pipeline.
The trap: doing the work before answering
Imagine the straightforward implementation of an ingestion endpoint. A log arrives, and the handler does the obvious thing: validate it, normalize it, compute the fingerprint, run it through clustering, upsert the incident in PostgreSQL, fire the Slack notification, and then return 200 OK. The handler does the whole job and then reports success.
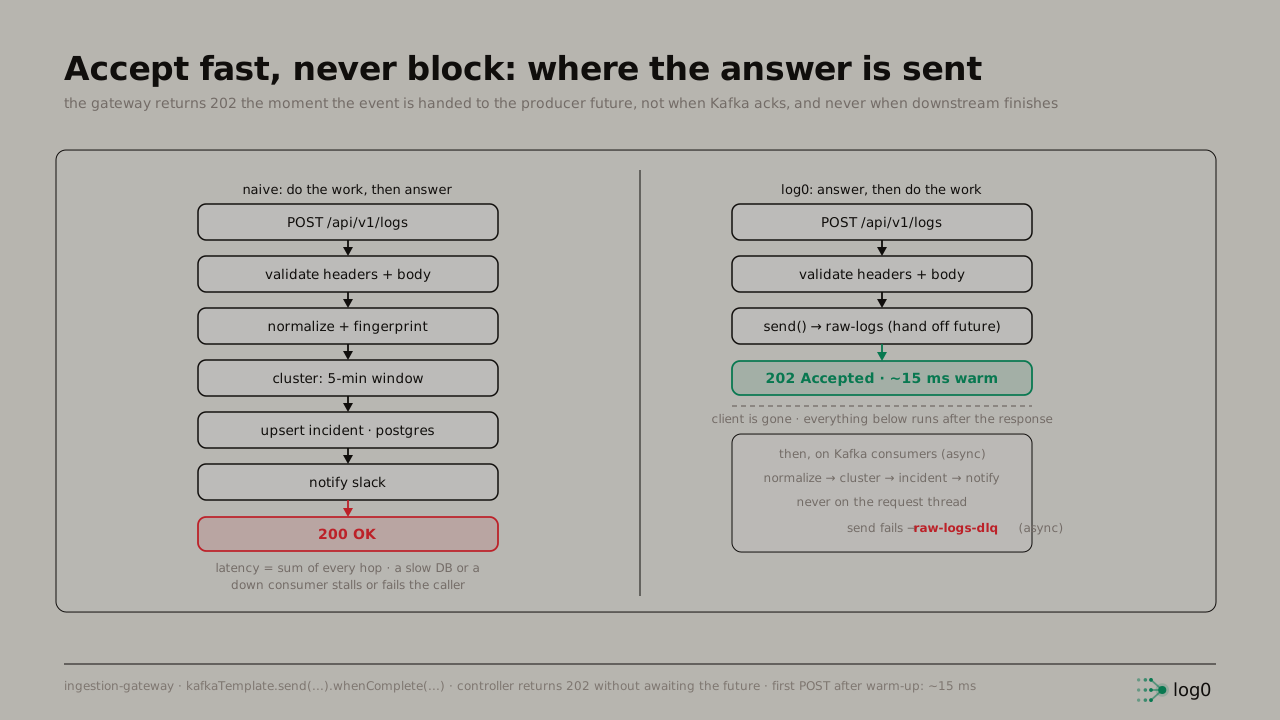 Two lanes for the same request. Left, the naive path runs validate, normalize, cluster, upsert, notify inline and only then returns 200, so latency is the sum of every hop. Right, log0 validates, hands the event to the producer future, returns 202 the instant the event is queued, and runs everything downstream asynchronously on Kafka consumers
The left lane is that design. It is correct, and it is a trap, for two reasons.
The first is latency. The response time the caller sees is the sum of every hop. Validation plus a fingerprint plus a clustering window lookup plus a PostgreSQL write plus an HTTP call to Slack. The caller, some service trying to emit a log line, is now blocked on a chain it does not care about and should never see.
The second is worse: coupling availability to the slowest dependency. If PostgreSQL is under load, every log POST slows down. If Slack's API is having a bad day, the ingestion endpoint is having a bad day. If the clustering consumer is down entirely, ingestion returns errors, for logs, which is precisely when something is going wrong and they are most needed. The endpoint whose entire purpose is to never be down has been wired so that anything downstream can take it down. That is backwards.
The fix: answer the moment the event is durable enough
The right lane is log0. The gateway does the minimum, validate the request, build the event, hand it to the Kafka producer, and returns 202 Accepted right there. Not 200 OK, because nothing has been processed yet; 202 means "accepted for processing," which is the honest status. Everything else, normalize, cluster, incident, notify, happens afterward on Kafka consumers, with each hop being a topic, none of it on the request thread.
The controller is deliberately thin:
@PostMapping
public ResponseEntity<Void> ingestLog(
        HttpServletRequest request,
        @Valid @RequestBody LogIngestionRequest logRequest) {
    // tenant is derived from the validated API key by ApiKeyAuthFilter, not a client header
    String tenantId    = (String) request.getAttribute(ApiKeyAuthFilter.TENANT_ATTRIBUTE);
    String serviceName = RequestHeaderExtractor.getRequiredHeader(request, HeaderConstants.SERVICE_NAME);
    String environment = RequestHeaderExtractor.getRequiredHeader(request, HeaderConstants.ENVIRONMENT);
    String apiKey      = RequestHeaderExtractor.getRequiredHeader(request, HeaderConstants.API_KEY);

    RequestContext context = new RequestContext(tenantId, serviceName, environment, apiKey);
    logIngestionService.ingest(logRequest, context);

    return ResponseEntity.accepted().build();   // 202, immediately
}
It reads the tenant that the auth filter already resolved from the API key, reads the service and environment headers, validates the body via bean validation, calls ingest, and returns 202. There is no clustering here, no database, no enrichment. That is the entire point: the handler cannot be slow, because it does not contain anything slow.
The detail that makes it non-blocking: the producer future
The interesting line is one level down, in the producer. It is easy to think "writes to Kafka, so it returns fast," but there is a subtlety here, because there is a way to write this that quietly reintroduces the blocking that was removed.
public void publish(RawLogEvent event) {
    kafkaTemplate.send(KafkaTopics.RAW_LOGS, event.getTenantId(), event)
        .whenComplete((result, ex) -> {
            if (ex != null) {
                log.error("Failed to publish raw log event: {}", ex.getMessage(), ex);
                DlqEvent dlqEvent = DlqEvent.builder()
                        .originalEvent(event)
                        .errorMessage(ex.getMessage())
                        .failedAt("ingestion-gateway")
                        .failedAtTs(Instant.now())
                        .build();
                dlqProducer.publish(event.getEventId(), dlqEvent);
            }
        });
}
kafkaTemplate.send(...) returns a CompletableFuture. The code attaches a whenComplete callback to it and returns immediately. It never calls .get(), never blocks the request thread waiting for the broker to acknowledge the write. The acknowledgement, success or failure, arrives later, on a Kafka producer-network thread, and the callback handles it there.
This is the difference between accept-fast and a slower, sneakier version of process-inline. If this code called .get() on the future, the request thread would block until Kafka confirmed the write, and now ingestion latency is coupled to broker latency and broker availability. Attaching a callback instead means the request thread is free the instant the event is queued in the producer's buffer. The 202 goes back to the caller; the broker round-trip happens out of band.
The callback is not only fire-and-forget, though. If the send ultimately fails, the whenComplete handler wraps the event in a DlqEvent and routes it to raw-logs-dlq, asynchronously. So "never block" does not mean "drop on failure." A failed write is captured and quarantined for inspection, off the request path. The caller already got its 202, and the durability concern is handled where it belongs, in the background.
One more thing the producer does for free: it keys the record by tenantId. That co-locates a tenant's events in the same partition, which buys per-tenant ordering and is the foundation of the tenant-isolation story in a later post. It costs nothing here; it is only the partition key on the send.
What "fast" measures: 50 to 800 concurrent users
Accept-fast is a nice theory. The question is whether it holds up under real concurrency, so I drove POST /api/v1/logs with k6 at a constant-VU sweep, 50 users up to 800, median of three runs each.
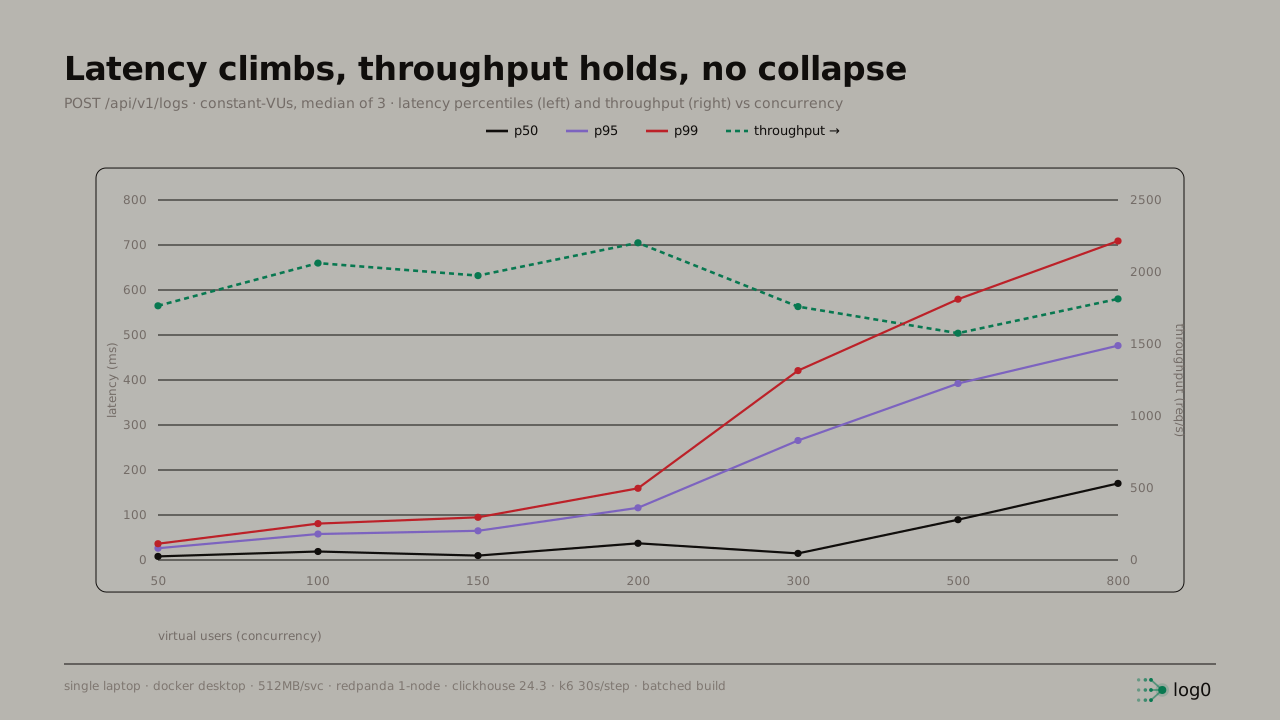 Latency percentiles and throughput vs concurrency. p50 stays near the floor through 300 VUs then climbs at the top of the sweep, p99 climbs from about 36ms at 50 VUs to 709ms at 800 VUs, throughput holds in a band roughly 1,600 to 2,200 req/s, and the error rate stays under half a percent
Three things to read off it.
p50 holds near the floor until the top of the sweep. The median request stays single-digit to low-double-digit milliseconds through about 300 VUs, then climbs as the laptop runs out of cores, roughly 90 ms at 500 VUs and 170 ms at 800. The typical caller's experience holds flat across the range a single laptop is comfortable with, because the handler has no slow work in it to contend on, and only stretches once scheduling pressure dominates at the top end.
p99 climbs, and that is expected. The tail goes from about 36 ms at 50 VUs to 709 ms at 800 VUs. That is contention, more virtual users than cores, requests queuing for threads, the usual cost of pushing a single laptop past its comfortable concurrency. The honest read is not "the endpoint got slow" but "the tail stretched under load while the median held," which is exactly the shape accept-fast predicts: no inline dependency to fall over, only scheduling pressure.
Throughput holds and almost nothing drops. Across the sweep, throughput stays in a band, roughly 1,600 to 2,200 req/s, and the error rate stays under half a percent, peaking at 0.39% at 800 VUs. There is no collapse, no cliff where the endpoint stops accepting. It bends, it does not break. That is the property that matters for a logging front door: degrade gracefully, never go to zero.
For context, the same gateway in a sustained single-run benchmark accepted 181,995 requests over 60 seconds, 3,032 req/s, p99 156 ms. Per request the gateway does almost nothing, validate and hand off to a producer future, no parse, no database, no wait. But it is the front door, so it pays for that cheapness in volume, not in per-request cost: under load it was the busiest application container in the stack, around 226% CPU (about 2.3 cores) at a steady ~509 MB. Cheap work, done a lot of times, with nothing in the handler that blocks.
The tradeoff, stated plainly
Accept-fast is not free, and pretending otherwise would be dishonest. The cost is that 202 is a promise, not a receipt.
When the caller gets 202 Accepted, the log has not been processed. It has not been fingerprinted, not clustered, not turned into an incident. All of that is eventually consistent, seconds behind, happening on consumers the caller never sees. A synchronous "your log created incident X" answer is something this architecture cannot give, by construction.
For a logging pipeline, that is obviously the right trade. Nobody emitting a log line wants to block on incident detection; they want the line to be accepted and to get on with their work. But it is a real constraint, and it shows up downstream: detection latency is a separate measurement (end-to-end first-error-to-incident is its own post), and any UI on top of this has to be built for eventual consistency, not request-response. log0 trades a synchronous result for an endpoint that cannot be taken down by the things behind it. For this job, that is the right trade.
What is not done
- There is no backpressure signal to the client. Under genuine overload the gateway will keep accepting and let latency rise rather than shedding load. A production version wants a
429path when the producer buffer saturates. Today it bends gracefully but does not push back. - The DLQ on send-failure is wired, but there is no automated re-drive. Failed events land in
raw-logs-dlqand are preserved, but replaying them back into the pipeline after the cause is fixed is a manual step, not yet tooling. - The numbers are single-node, one laptop (Docker Desktop, 512 MB per service, single Redpanda node, k6). The 800-VU tail and the throughput band characterize this configuration's behavior, not a capacity ceiling. A broker that the next post will show OOMs under stress is part of that same honest picture.
Next: post 5, where it broke. Accept-fast moves the work downstream; this is what happened when one of those downstream consumers wrote to the database the naive way, one row at a time, and the producer-consumer mismatch you could watch build up and then drain.
Try log0
log0 is the platform this series is built on, an open, multi-tenant incident pipeline you can run yourself or use hosted.
- Platform: log0.in
- Docs: log0.in/docs
- Console: console.log0.in
- charfield, the ASCII animation registry behind the log0 front ends: charfield.log0.in
Written by Ashmit JaiSarita Gupta. Find me on LinkedIn, GitHub, and X, and read the rest of the series on Hashnode.