Single-row INSERTs in ClickHouse: why normalization became the bottleneck
After accept-fast ingestion, log0's normalization consumer capped out at about 40 rows per second while Kafka consumer lag peaked at 67,000 messages. This post explains MergeTree part churn and why one-row INSERTs do not fit a columnar write path.

Full-stack Software Engineer - (Builder of log0)

Accept-fast moves all the real work downstream, onto consumers. So the first place log0 fell over was a consumer: the one writing logs to ClickHouse. It drained about 40 rows per second while burning 171% of a CPU, the pipeline produced rows far faster, and the backlog climbed past 67,000 messages and would not come down. This post is the diagnosis: what the wall looked like, and why a columnar store punishes exactly the access pattern that felt most natural to write.
This is post 5 in a series on building log0. Post 4 ended on a promise: the gateway returns 202 fast and pushes the work to consumers. This post is what happens when one of those consumers does the obvious thing and writes to the database one row at a time.
The symptom: a backlog that only grows
The ingestion side was healthy. The gateway was accepting thousands of requests per second, cheap per request and never blocking, exactly as designed. Events were landing on raw-logs, normalization was consuming them, computing fingerprints, and writing each normalized event to ClickHouse.
Then I watched the consumer lag on a burst and it did this:
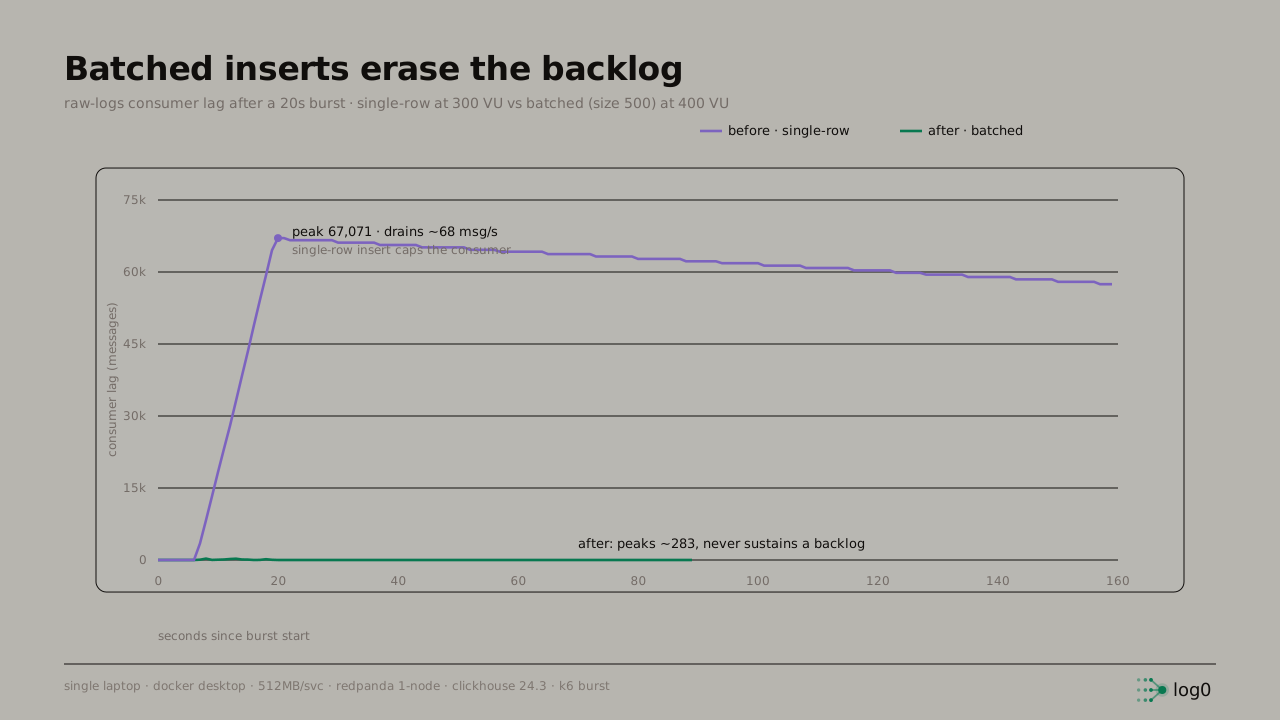 raw-logs consumer lag over time after a 20-second burst. The single-row line climbs almost vertically to a peak of 67,071 messages and then drains agonizingly slowly at about 68 messages per second; the batched line stays flat on the floor, peaking near 283 and never sustaining a backlog
Look at the purple line. A 20-second burst pushed the lag to a peak of 67,071 messages, and then it barely moved. It drained at roughly 68 messages per second. At that rate, clearing the backlog from one short burst takes about 16 minutes, and any sustained load would mean the lag never comes down at all, it grows until something runs out of memory. (The green line is the fix, and that is post 6. For now, look only at the purple.)
The producer side was fine. The broker was fine. The gateway was fine. The single slow thing was the database write, and because everything upstream of it was fast, all that speed piled up in front of the one slow consumer.
The bottleneck: about 40 rows per second, at 171% CPU
I isolated the ClickHouse write path and measured it directly. The naive implementation was the obvious first one: for each normalized event, execute one INSERT.
// the naive version: one INSERT per event
public void save(NormalizedLogEvent event) {
    try (Connection conn = clickHouseDataSource.getConnection();
         PreparedStatement stmt = conn.prepareStatement(INSERT_SQL)) {
        bind(stmt, event);     // one row
        stmt.executeUpdate();  // one round trip, one part
    }
}
Clean, obvious, and a wall. This sustained about 40 rows per second while consuming 171% CPU on the ClickHouse server. (The ~68 messages per second the backlog drained at on the chart is the same wall seen from the other side: that is the observed lag-drain rate of one burst, while 40 rows/sec is the isolated steady-state write throughput I measured directly. Same bottleneck, two vantage points, same order of magnitude.) Not 40 rows per second because the data was large, the rows are tiny. Not because the disk was slow. It burned more than a full core to write 40 small rows a second, which is a tell that the cost is not in the data at all. It is in the access pattern.
Put the two numbers next to each other. The pipeline can produce normalized rows at thousands per second; the writer drains them at forty. That is roughly a 70x mismatch between production and consumption, and a 70x mismatch has only one possible outcome: an unbounded backlog. The drain chart is that mismatch made visible.
Why a columnar store hates this
The reason single-row inserts are pathological here is specific to what ClickHouse is. It is a columnar OLAP store, and its storage engine, MergeTree, is built around a particular assumption: data arrives in large chunks, infrequently.
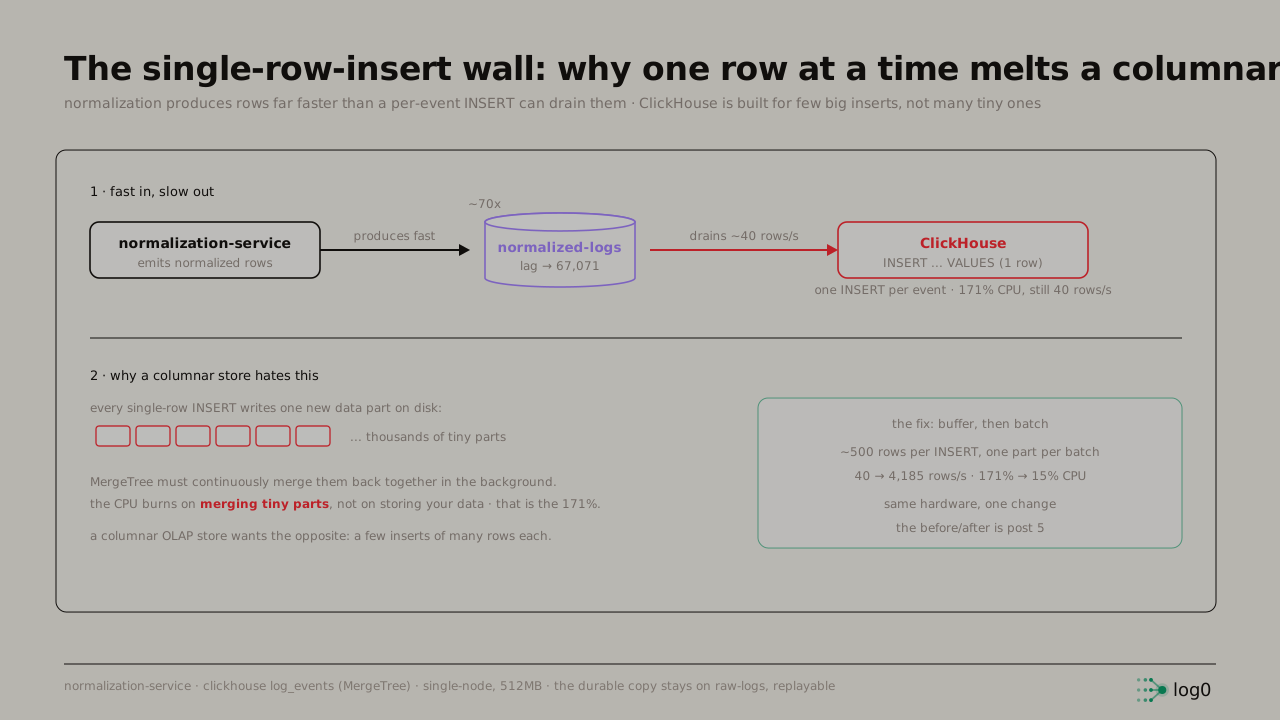 A two-band explanation. Top: normalization-service produces rows fast into the normalized-logs backlog which climbs to 67,071, while ClickHouse drains at 40 rows per second per single-row INSERT at 171% CPU, a 70x mismatch. Bottom: every single-row INSERT writes one new data part, producing thousands of tiny parts that MergeTree must continuously merge in the background, which is where the CPU goes
Here is the mechanism. Every INSERT creates a new data part on disk. A part is a self-contained, sorted, compressed chunk of columnar data, with its own column files, its own index, its own metadata. That structure is what makes columnar reads fast. It is also relatively expensive to create, and it is meant to be created in bulk.
Insert one row, and ClickHouse makes a part to hold that one row. Insert another, another part. Do it at the pipeline's rate and it manufactures thousands of tiny single-row parts. And ClickHouse cannot leave them there, because a table that is thousands of fragments is unqueryable, so MergeTree runs a continuous background process to merge small parts back into larger ones. That merging is real work: read the parts, merge-sort them, recompress, write the result, delete the originals.
So the 171% CPU is not being spent storing those forty rows. It is being spent in the background, merging the thousands of tiny parts that the forty-rows-per-second of inserts keep producing, while new tiny parts arrive faster than the merge can consolidate them. The server is busy doing cleanup for a workload it was explicitly designed to avoid. The database is not being used wrong in a way it forbids; it is being used wrong in a way it tolerates and then quietly chokes on.
A row-oriented store like PostgreSQL would shrug at single-row inserts, that is its bread and butter. ClickHouse is the opposite tool: phenomenal at GROUP BY fingerprint over millions of rows, miserable at one tiny write at a time. The two-databases decision from Post 0 is exactly this: logs go to ClickHouse for the analytics, incident state goes to Postgres for the transactional writes, because no single engine is good at both. Picking ClickHouse for logs was right. Writing to it one row at a time was the bug.
The shape of the fix, and why it belongs to the next post
The fix follows directly from the diagnosis: if the store wants few large inserts, stop giving it many tiny ones. Buffer the rows in memory and flush them as one batched INSERT when the buffer fills or a timer fires, so one part holds hundreds of rows instead of one. That is the inversion the green box in the diagram points at, about 500 rows per insert, one part per batch, and it takes the path from 40 rows per second to 4,185 at 15% CPU. Same hardware, one structural change.
I am deliberately not detailing it here, because the before-and-after is worth its own post, and the numbers are dramatic enough to carry one. What matters for this post is the diagnosis, because the diagnosis is the reusable part. The fix is specific to ClickHouse; the lesson, match the write pattern to what the storage engine is built for, and measure the consumer, not only the producer, is not.
What is not done
- The buffered batch lives in memory between flushes. A hard crash loses whatever has not been flushed. log0 accepts this on purpose: ClickHouse here is append-only analytics storage, not the system of record. The durable copy stays on the
raw-logstopic, which is replayable, so a lost buffer is recoverable and must never block the pipeline. That tradeoff is a deliberate choice, not an oversight, but it is a tradeoff. - On a ClickHouse write failure, the batch is dropped, not requeued. Requeuing a failed batch risks unbounded memory growth if ClickHouse is down for a while, so the writer logs and drops, and relies on
raw-logsreplay for recovery. This keeps the pipeline alive but means recovery is a manual replay, not automatic. - All numbers are single-node, one laptop (Docker Desktop, 512 MB per service, single ClickHouse node 24.3). The 40-rows-per-second wall and the 67,071 peak characterize this configuration; a tuned multi-node ClickHouse would move the absolute numbers, but the single-row-insert anti-pattern is engine behavior, not a hardware artifact.
Next: post 6, one change, roughly 100x.. The same write path, buffered and batched: 40 rows per second becomes 4,185, 171% CPU becomes 15%, and that flat green line on the drain chart is the whole story. Here is the buffer, the flush, and the three lines of configuration that decide it.
Try log0
log0 is the platform this series is built on, an open, multi-tenant incident pipeline you can run yourself or use hosted.
- Platform: log0.in
- Docs: log0.in/docs
- Console: console.log0.in
- charfield, the ASCII animation registry behind the log0 front ends: charfield.log0.in
Written by Ashmit JaiSarita Gupta. Find me on LinkedIn, GitHub, and X, and read the rest of the series on Hashnode.