Decoupling incident creation from LLM summary generation
log0 persists incidents as soon as detection completes and requests summaries on a separate async path with an HTTP callback. The post explains the boundary, provider rate limits, and why HTTP 202 means accepted, not summarized.

Full-stack Software Engineer - (Builder of log0)
I created 20 incidents and asked each one for an LLM-written summary. Every incident was live in about 403ms (post 10) with its
ai_summarycolumn stillnull. The summaries were supposed to arrive later, on a different thread, written back by a callback that patches the text onto an incident that has already existed for seconds. Exactly one of the 20 came back with a real generated summary, 2156ms after the request. The other 19 hit the provider's free-tier rate limit, returned in about 64ms with no text, and leftai_summarynull, where it will stay, because nothing retries them. The incident never waited for any of this. That is the whole design: the summary is best-effort, decoupled by exactly one@Asyncboundary, and the202the AI service hands back means the request was handled, not that a summary exists.
This is post 11 in a series on building log0. Post 10 ended with a NEW incident landing 403ms after the tenth matching log, and promised this one: the LLM-written summary that the incident must not wait for. An incident has to exist the instant detection fires, so an operator can be paged and start working. A language model takes seconds, sometimes fails, and on a free tier is throttled most of the time. Those two facts cannot share a request. This post is about the one boundary that keeps them apart, the callback that closes the loop afterward, and why a 202 here is, once again, a promise rather than a result.
The constraint: the model is slow, the incident is not
The incident-creation path from Post 10 finishes in under half a second. An LLM summary of that incident takes single-digit seconds on a good day and never returns on a bad one. If summary generation sat inside createOrUpdateIncident, every incident would inherit the model's latency and its failure modes: the page would wait on the prompt, a throttled provider would stall creation, and a model outage would become an incident-detection outage. That is exactly backwards. The summary is a convenience laid on top of an incident; the incident is the thing that must exist no matter what the model does.
So the summary cannot be a return value. It has to be produced out of band and attached later, which means the creation path needs a way to say "start working on a summary" and then immediately forget about it. In Spring, that fire-and-forget is one annotation, and getting it to truly fire asynchronously is less obvious than it looks.
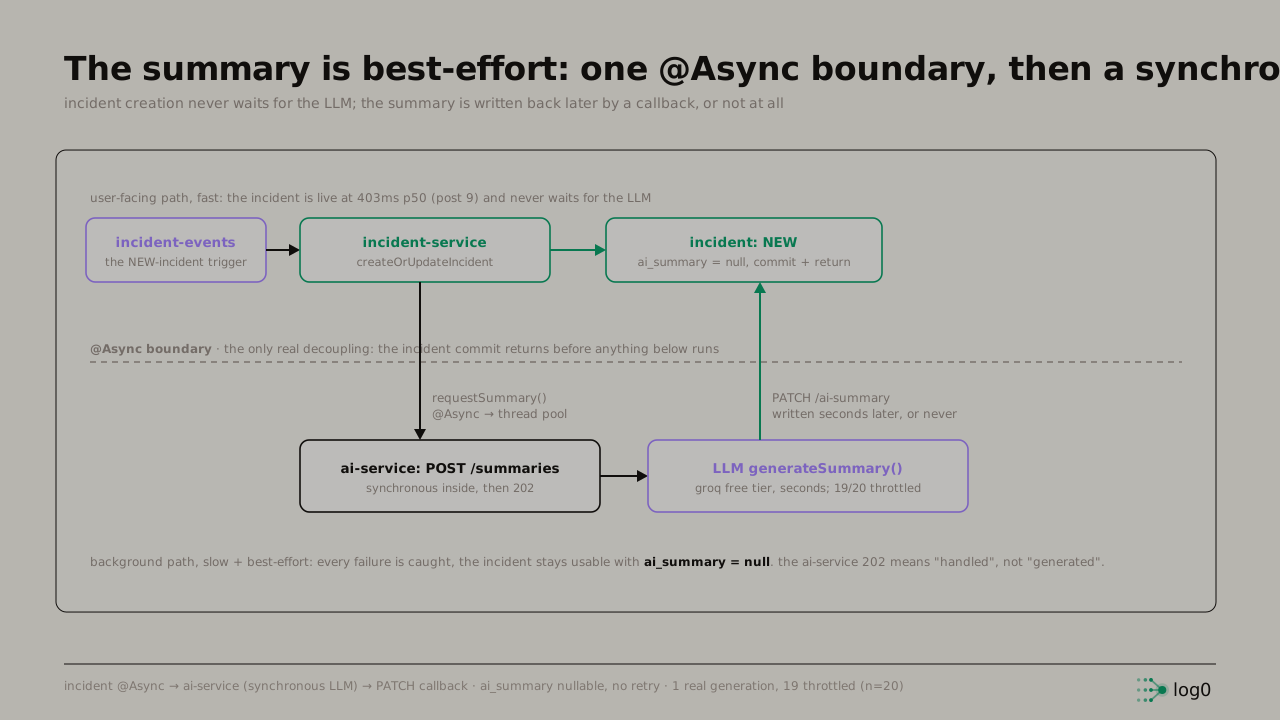 A two-lane diagram of the AI summary path. The top lane is user-facing and fast: an incident-events trigger flows into incident-service createOrUpdateIncident, which commits an incident in status NEW with ai_summary set to null and returns, live at 403ms p50 and never waiting for the LLM. A horizontal dashed line marks the @Async boundary, captioned as the only real decoupling, because the incident commit returns before anything below it runs. A downward arrow labelled requestSummary, @Async into a thread pool crosses the boundary into the bottom lane, which is the background, slow, best-effort path. There the ai-service POST /summaries box is marked synchronous inside, then 202, flowing into an LLM generateSummary box on the groq free tier that takes seconds and is throttled 19 times in 20. An upward green arrow labelled PATCH /ai-summary, written seconds later or never crosses back over the boundary to write the summary onto the already-live incident. A caption notes every failure on the background path is caught, the incident stays usable with ai_summary null, and the ai-service 202 means handled, not generated
One @Async boundary, and the bean that makes it real
The only true decoupling in this entire flow is a single @Async method on the incident side. When createOrUpdateIncident opens a NEW incident, the last thing it does before returning is hand the incident off to a summarizer that runs on a different thread:
// inside createOrUpdateIncident, after the NEW incident is saved
recordHistory(incidentId, null, "NEW", null);
aiSummarizer.requestSummary(incident);              // returns immediately, runs elsewhere
notificationPublisher.publish(buildNotificationEvent(incident, "INCIDENT_CREATED", null));
requestSummary is annotated @Async, so the call returns the moment it is made and the body runs on a pool thread. The incident transaction commits with ai_summary still null, the 202-style promise is kept to whoever triggered creation, and the model has not been touched yet:
@Component
public class AiSummarizer {

    @Async
    public void requestSummary(Incident incident) {
        try {
            aiClient.post()
                    .uri("/api/v1/summaries")
                    .body(toRequest(incident))      // incidentId, fingerprint, top messages
                    .retrieve()
                    .toBodilessEntity();
        } catch (Exception e) {
            log.warn("AI summary request failed for {}: {}", incident.getId(), e.getMessage());
        }
    }
}
Two details here are load-bearing. First, AiSummarizer is a separate bean, not a method on IncidentService. Spring implements @Async with a proxy, and a proxy is only consulted when one bean calls another. If requestSummary lived on IncidentService and was called from another method in the same class, the call would bypass the proxy entirely and run synchronously on the caller's thread, silently undoing the whole point. Putting it on its own bean is what guarantees the hop to a pool thread truly happens.
Second, the catch swallows everything. A failure to even reach the AI service must not propagate back into the creation path, because by the time requestSummary runs, the incident is already committed and the caller is already gone. There is nothing useful to throw to. The summary is best-effort from the very first line, and the worst case is an incident with no summary, which is a fully usable incident.
Below the boundary, the 202 is not what it looks like
Here is the part that surprised me when I read my own code back, and it is the honest correction to the framing I set up in post 10. The asynchrony is entirely on the incident side. The AI service itself is synchronous, and its 202 is misleading.
The endpoint that requestSummary calls does the full job before it answers:
@PostMapping("/api/v1/summaries")
public ResponseEntity<Void> createSummary(@RequestBody SummaryRequest request) {
    // The async boundary is on the Incident Service side (@Async), not here.
    // This call generates the summary and writes it back synchronously, then returns.
    summaryService.generateSummary(request);
    return ResponseEntity.accepted().build();          // 202, after all the work
}
generateSummary builds the prompt, calls the model, and PATCHes the result back, all in line, all on the request thread:
public void generateSummary(SummaryRequest request) {
    try {
        String prompt  = buildPrompt(request);
        String summary = llmProvider.generateSummary(prompt);            // blocks on the model, seconds
        incidentClient.updateAiSummary(request.incidentId(), summary);    // PATCH back onto the incident
    } catch (Exception e) {
        log.error("summary generation failed for {}: {}", request.incidentId(), e.getMessage());
        // ai_summary stays null; the incident is left exactly as it was
    }
}
So the 202 Accepted from the AI service does not mean "I have queued your summary." It means "I have already tried to generate and write your summary, and I am telling you I am done." The round-trip the incident's pool thread sees is the model's full latency, not a quick enqueue acknowledgement. That is why the latency chart below shows seconds, not milliseconds, on the one call that truly generated. A 202 is the right status code for "I will not give you the result on this response," but it carries no information about whether a summary now exists. The same convention appeared at the ingestion gateway in earlier posts, and it holds here: 202 is a receipt for the request, never a receipt for the outcome.
The llmProvider is a strategy interface chosen at startup, so this synchronous block can sit behind Groq, OpenAI, Gemini, or Anthropic without the service code changing:
@ConditionalOnProperty(name = "ai.provider", havingValue = "groq")
public class GroqProvider implements LlmProvider { /* ... */ }
The callback writes onto an incident that already exists
When the model does return text, the summary belongs to an incident that has been live for seconds. The AI service does not have a Kafka topic back to the incident service for this; it makes a direct PATCH:
void updateAiSummary(UUID incidentId, String summary) {
    incidentClient.patch()
            .uri("/api/v1/incidents/{id}/ai-summary", incidentId)
            .body(Map.of("aiSummary", summary))
            .retrieve()
            .toBodilessEntity();
}
On the incident side that lands on a method whose only job is to set one content column. It is deliberately not a state-machine transition, because ai_summary is not a status; writing it does not move the incident through its lifecycle, so it does not go through the transition guard from post 10:
public void updateAiSummary(UUID incidentId, String summary) {
    Incident incident = incidentRepository.findById(incidentId)   // see the gap below
            .orElseThrow(() -> new IncidentNotFoundException(incidentId));
    incident.setAiSummary(summary);
    incidentRepository.save(incident);
}
This is the callback closing the loop: a write that arrives after the fact and attaches a summary to a row that has long since been committed, paged on, and possibly already acknowledged by a human. The incident did not wait for it, and if it never arrives, nothing downstream breaks.
Proving it: one generation, nineteen throttles
I drove 20 incidents through this path on a free-tier Groq key and timed each summary round-trip as the incident's pool thread saw it, from the POST to the AI service until its 202 came back. Because the AI service does its work before answering, that round-trip is the model's real latency.
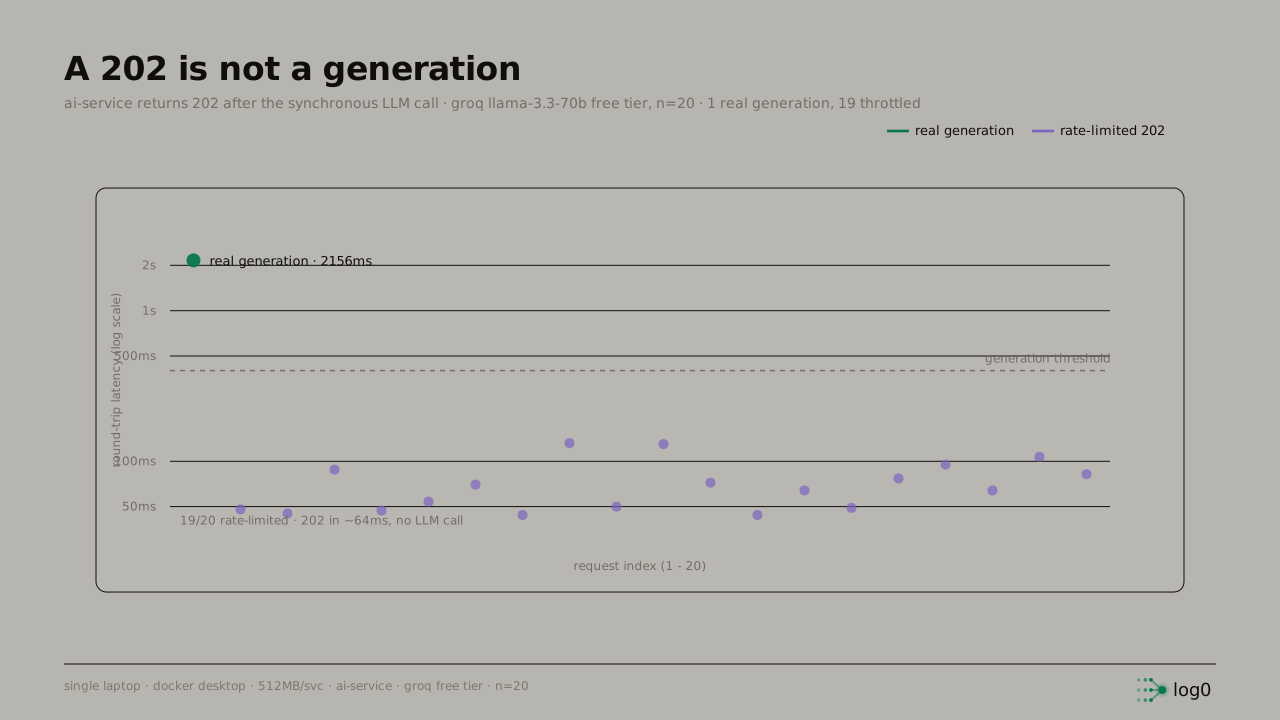 A log-scale scatter of AI summary round-trip latency over 20 requests. One green point sits high at 2156ms, labelled real generation, well above a dashed generation-threshold line at 400ms. The other nineteen points are clustered low between roughly 45 and 110ms, in purple, labelled 19 of 20 rate-limited, returning a 202 in about 64ms with no LLM call. The single generated summary cost the full model latency; every throttled call returned fast and empty
The shape says everything. One point sits up at 2156ms: the single request that the provider truly served, where the model generated text and the callback wrote it back. The other nineteen sit in a tight band around 64ms: these are the free-tier rate-limit rejections, where the provider returns a fast 429, no text is generated, the catch in generateSummary logs it, and the AI service still answers 202. Those nineteen incidents kept ai_summary null permanently, because there is no retry anywhere in this path. A throttled summary is one that never arrives.
This is not a flattering benchmark, and that is why it is here. It shows the real behavior of best-effort plus no retry on a throttled provider: the design is correct in that no incident was ever delayed or lost, and it is incomplete in that the feature it is delivering succeeds one time in twenty under these conditions. Both halves of that are true at once, and the chart refuses to let me pretend otherwise.
What is not done
- There is no retry, so a throttled summary is gone for good. Nineteen of twenty calls were rate-limited and left
ai_summarynullwith nothing to try them again. The honest fix is a bounded retry with backoff on the AI side, or moving summary requests onto their own Kafka topic so a throttled job is redelivered instead of dropped. Right now the success rate is whatever the provider's free tier allows in the moment. - The
@Asyncthread is held for the entire model latency. Because the AI service generates synchronously before returning, the incident-side pool thread that called it blocks for the full round-trip, up to the 2156ms seen here. A burst of new incidents can exhaust that pool and start queuing summary requests behind each other. The pool is decoupled from incident creation, which is the part that matters, but it is not free, and it is not sized for a storm. - The AI service
202is misleadingly synchronous. It returns202 Acceptedafter doing all of its work, which is technically defensible (it is not returning the result on that response) but invites a caller to assume the work is still queued. A200after a completed write, or a genuinely queued202with a real background worker, would each be more honest than the current middle ground. updateAiSummarylooks the incident up without a tenant scope. This is the same gap flagged in posts 8 and 10, seen from the callback side: it callsfindById(incidentId)rather than a tenant-scoped fetch. The incident id is a UUID and the path is internal, so it is not trivially exploitable, but it is an unscoped write and it should threadtenant_idlike every other path that touches an incident.- Everything is single-node and the sample is tiny. Twenty requests on one laptop (Docker Desktop, 512 MB per service, one Groq free-tier key) is enough to demonstrate the mechanism and the throttle behavior, not to characterize latency at scale. The
2156msis one real generation, n=1. The finding is the gap, not a distribution.
The reason this post leads with "the 202 is not a generation" is that it is the same lesson the gateway taught and the DLQ taught, arriving from a third direction. Accepting a request is cheap and says nothing about whether the work behind it succeeded. The incident is the durable thing, committed in 403ms and safe to page on; the summary is a best-effort note that may or may not catch up to it. Designing the two so that the slow, failing one can never hold back the fast, durable one is the actual feature. The summary being absent one time in twenty is the cost of being honest about which is which.
Next: post 12, the resource footprint, and the one service that fell over.. Seven services, Kafka, ClickHouse, and Postgres all share a single laptop at 512 MB each, and most of them are comfortable there. One was not: under a sustained ingest load, Redpanda's memory climbed until the broker was killed, and the whole pipeline stalled behind it. The next post measures where the memory truly goes, why the message broker is the component that breaks first, and what a 512 MB ceiling does to a system that was sketched for a datacenter.
Try log0
log0 is the platform this series is built on, an open, multi-tenant incident pipeline you can run yourself or use hosted.
- Platform: log0.in
- Docs: log0.in/docs
- Console: console.log0.in
- charfield, the ASCII animation registry behind the log0 front ends: charfield.log0.in
Written by Ashmit JaiSarita Gupta. Find me on LinkedIn, GitHub, and X, and read the rest of the series on Hashnode.