Resource limits and health checks when Redpanda runs on one machine
A single-host resource profile of log0 under ingest load: which containers consume CPU and memory, why Redpanda hit OOM first, and why Spring liveness did not reflect broker availability.

Full-stack Software Engineer - (Builder of log0)

Under a steady 100-VU ingest load, seven of log0's containers sit comfortably: each Spring service is capped at 512 MiB and the busiest of them, the ingestion-gateway, lands at 509 MiB against that ceiling while the rest idle between 67 and 307 MiB. The cap holds. The trouble is the three containers that have no such cap. Redpanda, ClickHouse, and Postgres share the Docker VM's 7.4 GiB with no per-container limit, and Redpanda is the fattest thing in the stack at 1.79 GiB, climbing about 6 MiB per second with no plateau even at this gentle load. Push harder, with a sustained 3x800-VU sweep and repeated bursts, and Redpanda's memory grows until the VM kills it: ExitCode 137, OOMKilled = true. The broker goes down, the gateway's producer starts throwing
UnknownHostException,POST /api/v1/logshangs, andGET /actuator/healthkeeps answering200 OKwith a{"status":"UP"}body the entire time.
This is post 12 in a series on building log0. The previous eleven posts measured throughput, latency, and correctness. This one measures weight: where the memory truly sits when the whole platform runs on one laptop, which component breaks first under stress, and why the thing that breaks is the thing I never put a limit on. It is also a correction. I have been describing this stack as "512 MB per service," and that is true for the seven Java services and false for the three data containers underneath them. The gap between those two facts is exactly where the system fell over.
Most of the stack is asleep
The first thing the footprint shows is how little of the system is doing anything at any given moment. Under a steady ingest load, only three containers are on the hot path, and the other seven are close to idle.
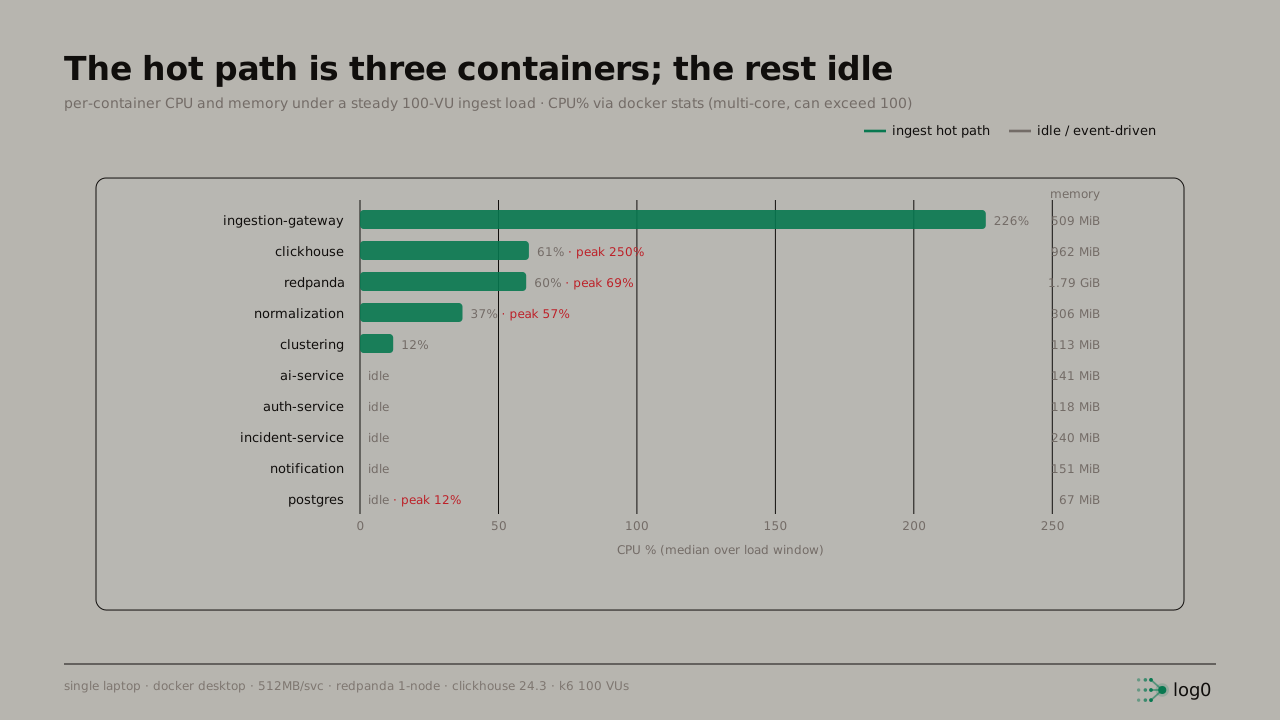 A horizontal bar chart of per-container CPU under a steady 100-VU ingest load, with a memory column on the right. The ingestion-gateway dominates CPU at 226 percent (multi-core), using 509 MiB. ClickHouse follows at 61 percent median with a 250 percent peak and 962 MiB; redpanda at 60 percent median, 69 percent peak, and 1.79 GiB; normalization at 37 percent and 306 MiB; clustering at 12 percent and 113 MiB. The remaining five containers, ai-service, auth-service, incident-service, notification, and postgres, are marked idle, using between 67 and 240 MiB. The hot path is three containers; the rest idle
The CPU story is the obvious one: the ingestion-gateway is the only thing under real pressure, at 226% (it is multi-core, so percentages exceed 100), because it is the front door taking every request. ClickHouse and Redpanda each sit around 60% median with brief peaks, and everything downstream of the queue is event-driven, so it spends most of its life waiting for a message that arrives in a trickle. Five services read as flat idle. That is the correct shape for an event-driven pipeline: work concentrates at the edge and at the stores, and the consumers in between are cheap.
The memory column tells a different and more important story. Read it on its own. The seven Spring services are all under their 512 MiB cap, most of them far under it: clustering at 113 MiB, auth at 118, ai-service at 141, notification at 151, incident at 240, normalization at 306, and ingestion pressed up against the ceiling at 509. Then the three data containers: ClickHouse at 962 MiB and Redpanda at 1.79 GiB, both well past 512, because neither is capped at 512 at all.
The configured cap is not the cap that matters
Here is the configuration detail that turns a footprint chart into a failure story. Every Java service runs with a hard memory limit, so when I say "512 MB per service" the Docker stats back it up: each one reads XXX MiB / 512 MiB. The three stateful containers do not. Their limit line reads X.X GiB / 7.431 GiB, which is the whole Docker VM. They are uncapped, free to grow into all the memory the VM has, and they compete for it with each other and with everything else.
That is fine right up until one of them does not stop growing. Sampling Redpanda's memory once every seven seconds under the steady 100-VU load, it climbs monotonically and never levels off inside the window:
t=0s    1.657 GiB
t=7s    1.703 GiB
t=14s   1.752 GiB
t=21s   1.793 GiB
t=28s   1.833 GiB
t=35s   1.873 GiB
t=42s   1.923 GiB
t=49s   1.946 GiB
That is roughly 6 MiB per second of growth at a load the system handles without breaking a sweat. A broker doing its job holds messages, indexes, and buffers in memory, and a single-node Redpanda with no ceiling will happily use whatever the host offers. At 100 VUs, the run ends before the climb becomes a problem. At a sustained 3x800-VU sweep with bursts on top, it does not: the curve keeps going until it meets the VM's hard wall, and the kernel's OOM killer picks the biggest process, which is the broker. The container exits 137, Docker records OOMKilled = true, and the queue at the center of the pipeline is suddenly gone.
The lesson is uncomfortable because it inverts the usual worry. I spent effort capping the Java services so a leak in application code could not take down the box, and that worked: not one of the seven was killed. The component that died is the one I left uncapped because it is infrastructure and "infrastructure manages its own memory." On a shared single-node VM, it does not. The container without a limit is the container that falls over first.
When the broker dies, the rest of the stack disagrees about it
The OOM is not the interesting part. The interesting part is what the rest of the system believes in the seconds after.
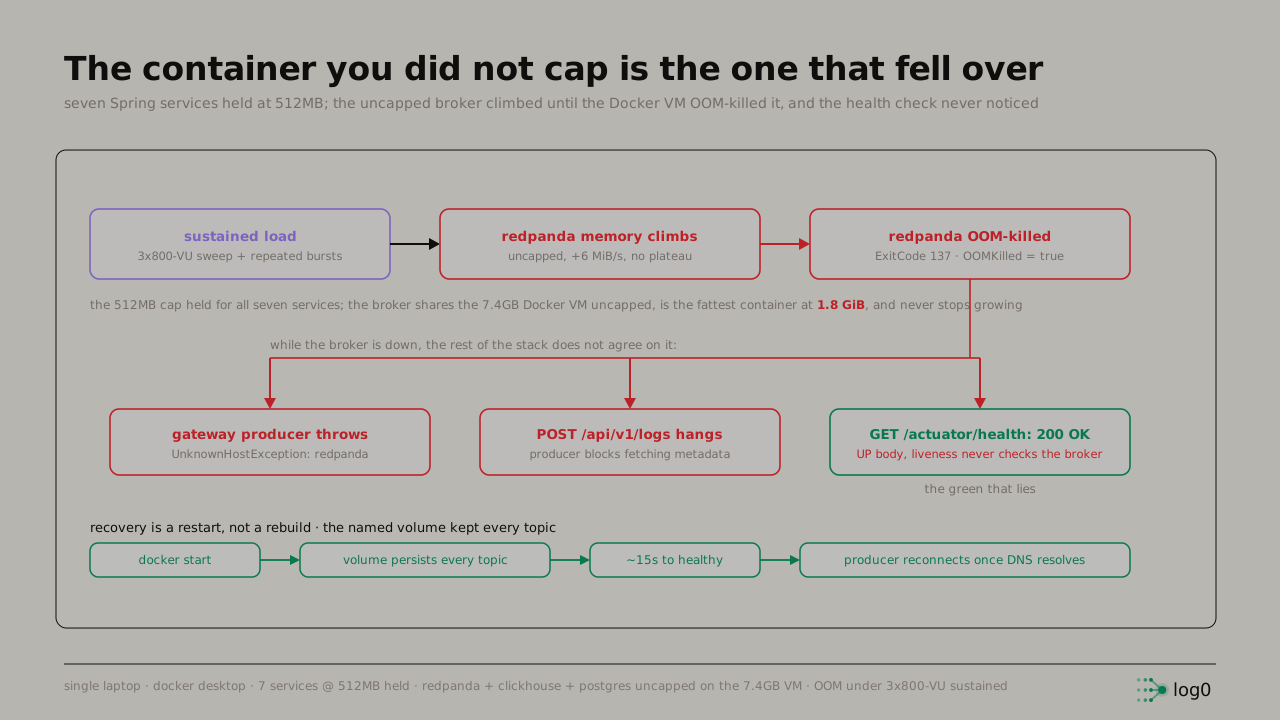 A cascade diagram of the Redpanda out-of-memory failure. A sustained-load box (3x800-VU sweep plus bursts) leads to a redpanda-memory-climbs box, marked uncapped, plus 6 MiB per second, no plateau, which leads to a redpanda-OOM-killed box marked ExitCode 137, OOMKilled equals true. A caption notes the 512MB cap held for all seven services while the broker, sharing the 7.4GB Docker VM uncapped, is the fattest container at 1.8 GiB and never stops growing. From the kill, a branch fans out to three consequences that occur while the broker is down: the gateway producer throws UnknownHostException redpanda; POST slash api slash v1 slash logs hangs because the producer blocks fetching metadata; and GET slash actuator slash health still returns 200 OK with an UP body because liveness never checks the broker, labelled the green that lies. A recovery band shows docker start, then the named volume persists every topic, then about 15 seconds to healthy, then the producer reconnects once DNS resolves
Three things happen at once, and they do not agree. First, the gateway's Kafka producer loses its broker. Because Redpanda's container is down, its Docker network alias stops resolving, so the producer's next attempt throws java.net.UnknownHostException: redpanda rather than a clean connection refusal. Second, POST /api/v1/logs stops returning. The accept-fast path from Post 4 depends on handing the event to the producer, and with no broker to send to, the producer blocks fetching metadata until it times out, so the request that used to finish in milliseconds now hangs. The front door is effectively closed.
Third, and this is the one that matters, GET /actuator/health keeps returning 200 OK with an UP health body. The liveness probe checks that the web server is running; it does not check that the broker the service depends on is reachable. So every dashboard and every orchestrator polling that endpoint sees green while the pipeline behind it accepts nothing. This is the same failure mode as post 1, arriving from the opposite direction. There, a health check passed for a service whose ingestion path had never once run. Here, a health check passes for a service whose ingestion path has stopped running. In both cases the probe answers a question nobody asked, and the honest one, "can this service do its actual job right now," goes unanswered.
Recovery is a restart, because the data was never in the broker's memory
The recovery is the part that argues for the design rather than against it. Bringing the broker back is one command:
docker start log0-redpandaRedpanda's topics live on a named Docker volume, not inside the container's memory or its writable layer, so the OOM kill destroyed a process, not data. On restart the broker reads its log segments back off the volume, every topic and every committed offset intact, and reaches a healthy state in about 15 seconds. The gateway's producer was retrying the whole time; once the redpanda alias resolves again, the next metadata fetch succeeds and publishing resumes with no redeploy and no manual intervention on the application side. A message that was accepted and durably written before the crash is still there; the loss window is the requests that were hanging on the dead producer, which never got their 202 and were never accepted in the first place.
That is the right failure boundary. The broker is allowed to die and come back as a stateless process over durable storage, which is exactly the property Post 9 leaned on for the dead-letter topic. What is missing is not durability; it is the system noticing, and refusing to claim health, while the broker is gone.
What is not done
- Redpanda is uncapped, so it fails by taking the VM with it. The immediate fix is a memory limit on the broker and the other data containers, the same way the Java services are limited, so that a runaway broker is constrained instead of competing with the whole host. A limit would turn "the VM OOM-kills the biggest process" into "Redpanda is throttled or restarts itself," which is a far more contained failure. Tuning Redpanda's own memory and reserve flags for a small footprint is the deeper version of the same fix.
- The health check does not check dependencies.
GET /actuator/healthreports200 OK(UP) with the broker dead. A readiness probe that verifies producer connectivity, distinct from a liveness probe that only checks the process, would let an orchestrator route traffic away from a gateway that cannot reach Kafka. As it stands, the most important failure in the system is invisible to the one endpoint built to report failure. - The producer blocks instead of failing fast. With no broker,
POST /api/v1/logshangs on the producer's metadata timeout rather than rejecting quickly with a503. Accept-fast was the whole point of that path; it should also fail fast when it cannot accept. A shortermax.block.msand an explicit "broker unavailable" response would convert a hang into an honest, quick error the client can react to. - There is no alert on broker liveness or on memory pressure. Nothing pages when Redpanda's memory crosses a threshold or when the container restarts. The OOM was found by watching
docker statsduring a load test, which is not how it should be found in anything resembling production. - All of this is single-node and single-laptop. One Redpanda broker, one ClickHouse, one Postgres, on Docker Desktop's VM. The OOM is a property of an uncapped broker on a shared, memory-constrained host, not a Redpanda defect; a real deployment would give the broker its own sized machine and a replication factor above one. The numbers here characterize this setup, and the value is the failure shape, not the gigabytes.
The reason to end the measurement posts on a failure is that it is the most honest thing the benchmarks produced. Throughput held, latency stayed tight, correctness checked out, and then the broker I never put a limit on ate the VM and the health check smiled through it. A system that runs is not the same as a system that reports the truth when it stops running. The footprint was the easy half of this post; the half that matters is that the one endpoint whose job is to report trouble was the last thing in the stack to know there was any.
Next: post 13, a step off the backend pipeline to the surface.. The log0 front ends share a background animation engine that renders procedural physics fields as ASCII glyphs, forty-four of them, and they started life trapped inside one app. The next post is about extracting that engine into charfield, my first published npm package: a shadcn-style copy-in registry where npx charfield add galaxy writes the source of one animation into your repo, why I chose copying source over a versioned library, and what shipping it taught me about npm that no backend service in this series did.
Try log0
log0 is the platform this series is built on, an open, multi-tenant incident pipeline you can run yourself or use hosted.
- Platform: log0.in
- Docs: log0.in/docs
- Console: console.log0.in
- charfield, the ASCII animation registry behind the log0 front ends: charfield.log0.in
Written by Ashmit JaiSarita Gupta. Find me on LinkedIn, GitHub, and X, and read the rest of the series on Hashnode.