Batching ClickHouse INSERTs in a Kafka normalization pipeline
log0 buffers normalized log events and flushes with JDBC batch INSERTs (500 rows or 1 second). On the same hardware, write throughput rose from 40 to 4,185 rows per second and consumer lag went to zero.

Full-stack Software Engineer - (Builder of log0)

Post 5 ended on a wall: a ClickHouse writer that drained about 40 rows per second while burning 171% of a CPU, with a backlog that climbed past 180,000 under sustained load and would not come down. The fix is small. Buffer normalized rows in memory, flush them as one batched
INSERTwhen the buffer fills or a timer fires, and let one MergeTree part hold hundreds of rows instead of one. On the same laptop, that took the writer from 40 rows per second to 4,185, dropped ClickHouse CPU from 171% to 15%, and put the backlog on the floor. Here is the buffer, the flush, and the three lines of configuration that decide it.
This is post 6 in a series on building log0. Post 5 was the diagnosis: a columnar store punishes one-row-at-a-time writes because every INSERT makes a new data part, and MergeTree burns the CPU merging the thousands of tiny parts back together. This post is the fix, and it is the kind of fix worth its own post, because the diagnosis was three paragraphs of theory and the result is a number that changes by two orders of magnitude.
The inversion, in one sentence
The diagnosis told us exactly what to do. ClickHouse wants few inserts of many rows; the naive writer was giving it many inserts of one row. So invert it: stop inserting on every event, accumulate events in memory, and insert them all at once.
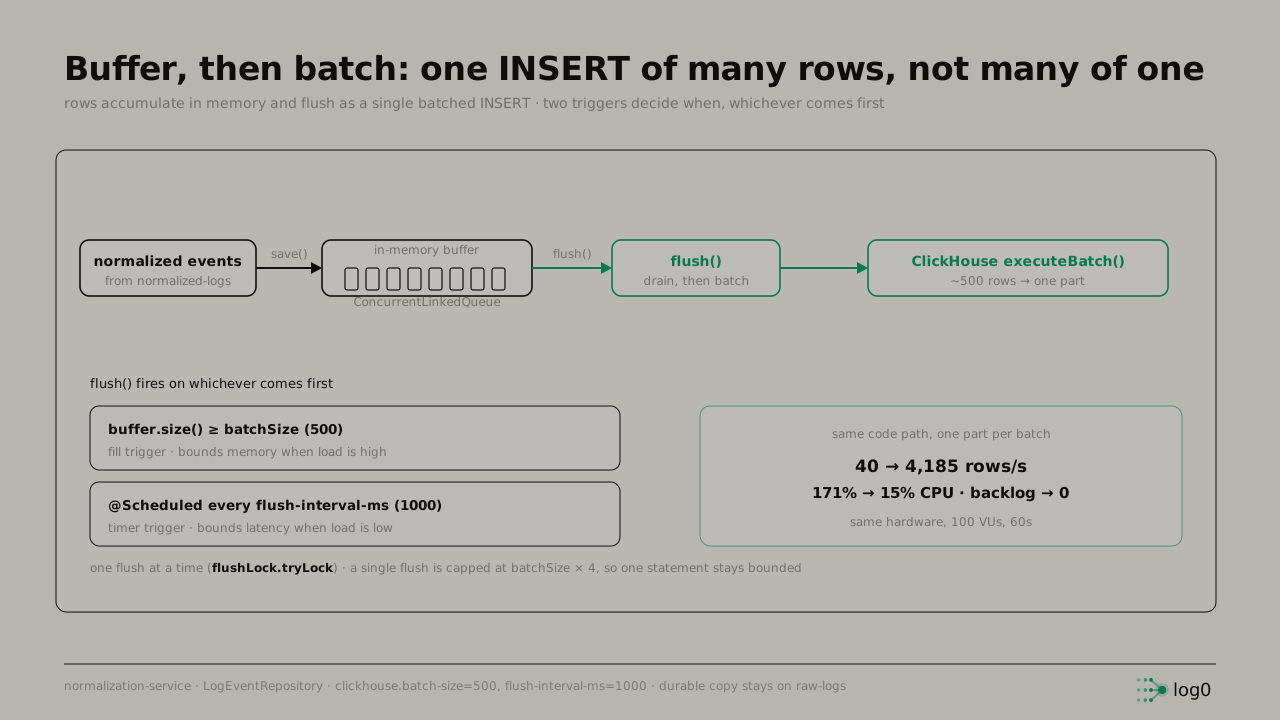 Buffer-then-batch design. Normalized events arrive and save() appends them to an in-memory ConcurrentLinkedQueue. flush() drains the buffer and writes it as one ClickHouse executeBatch of roughly 500 rows, which becomes a single MergeTree part. flush() fires on whichever comes first: a fill trigger when buffer size reaches batchSize 500, or a timer trigger every flush-interval-ms 1000. One flush runs at a time via flushLock.tryLock, capped at batchSize times 4. Result on the same hardware: 40 to 4,185 rows per second, 171% to 15% CPU, backlog to 0
That is the whole design in one picture. The write path is the same executeBatch it always was; the only difference is how many rows go through it per call. Everything interesting is in the two questions that produces: where do the rows wait, and when to flush them.
Where the rows wait: an in-memory buffer
save no longer touches the database. It appends to a queue and returns.
private final Queue<NormalizedLogEvent> buffer = new ConcurrentLinkedQueue<>();

public void save(NormalizedLogEvent event) {
    buffer.add(event);
    if (buffer.size() >= batchSize) {
        flush();   // fill trigger: don't wait for the timer
    }
}
ConcurrentLinkedQueue matters here. Normalization runs on multiple Kafka consumer threads, so save is called concurrently, and the buffer has to take concurrent appends without a lock around every add. The queue is lock-free for add, so the hot path, the part that runs on every single event, stays cheap. The expensive part, the actual database write, happens elsewhere and rarely.
Notice that save does almost nothing now. It adds to a queue, checks a size, and on most calls returns immediately. The cost of writing to ClickHouse has been lifted off the per-event path entirely and moved onto the flush, which runs a few times a second instead of thousands of times a second. That relocation is the entire performance story.
When to flush: two triggers, whichever comes first
A buffer raises one real question: when to empty it. Flush too eagerly and it is back to tiny inserts. Flush too lazily and rows pile up in memory and arrive late. log0 uses two triggers, and the right answer is to use both, because they cover opposite failure modes.
The fill trigger is the if (buffer.size() >= batchSize) check in save. When enough rows have accumulated, flush immediately without waiting. This is the one that matters under high load: when events are pouring in, the buffer hits 500 in a fraction of a second and flushes on size, so memory stays bounded no matter how fast the producer goes. It bounds memory.
The timer trigger is a scheduled flush that fires on an interval regardless of how full the buffer is.
@Scheduled(fixedDelayString = "${clickhouse.flush-interval-ms:1000}")
public void flush() {
    if (buffer.isEmpty() || !flushLock.tryLock()) {
        return;   // nothing to do, or a flush is already running; skip this tick
    }
    try {
        int max = batchSize * 4;            // cap one statement's size
        List<NormalizedLogEvent> batch = new ArrayList<>(Math.min(max, buffer.size()));
        NormalizedLogEvent e;
        while (batch.size() < max && (e = buffer.poll()) != null) {
            batch.add(e);
        }
        if (batch.isEmpty()) return;
        try (Connection conn = clickHouseDataSource.getConnection();
                PreparedStatement stmt = conn.prepareStatement(INSERT_SQL)) {
            for (NormalizedLogEvent ev : batch) {
                bindRow(stmt, ev);          // setString(...) for each column
                stmt.addBatch();
            }
            stmt.executeBatch();            // one round trip, one part
        } catch (SQLException ex) {
            // drop this batch, do not requeue; rows stay replayable from raw-logs
            log.error("Failed to flush {} events: {}", batch.size(), ex.getMessage(), ex);
        }
    } finally {
        flushLock.unlock();
    }
}(bindRow stands in for the eleven stmt.setString(...) / setTimestamp(...) calls the real code inlines, one per column; the batch insert is a plain JDBC addBatch / executeBatch against a single PreparedStatement.)
This one matters under low load. If only three events arrive in a quiet minute, the fill trigger never fires, and without a timer those three rows would sit in the buffer forever. The @Scheduled flush every 1000 ms guarantees that whatever is in the buffer lands within a bounded delay. It bounds latency.
Together they read as one rule: flush on whichever comes first, fill or timer. High load, the fill trigger keeps memory in check; low load, the timer keeps latency in check. Neither alone is enough; both together cover the whole range.
Two details in that flush keep it safe under concurrency. flushLock.tryLock() means only one flush runs at a time: if the timer fires while a fill-triggered flush is already draining the buffer, the timer tick sees the lock held and returns, instead of two threads racing on the same queue and the same statement. And int max = batchSize * 4 caps how many rows a single flush will pull, so even if the buffer has surged to tens of thousands of rows, one executeBatch stays bounded at 2,000 rows rather than trying to send an unbounded statement in one shot. A backlog drains over several flushes, each a sane size, instead of one giant insert that could blow up memory or time out.
The result: 40 to 4,185, on the same laptop
This is the part that earns the post. Nothing about the hardware changed. Same laptop, same single ClickHouse node, same executeBatch code path. The only change is that rows are buffered and flushed in groups of roughly 500 instead of one at a time. Here is the before and after, measured the same way under the same load.
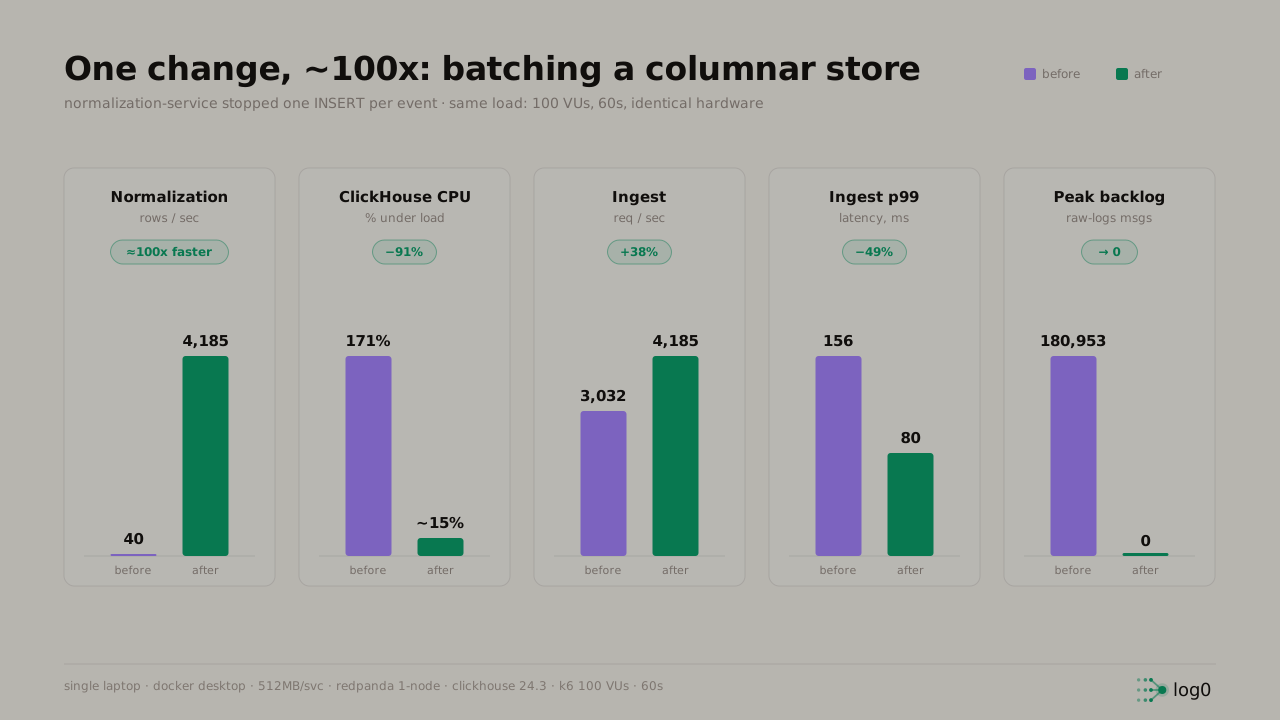 Five before-and-after panels for the batched writer versus the single-row writer. Normalization throughput goes from 40 to 4,185 rows per second, roughly 100x. ClickHouse CPU drops from 171% to about 15%, a 91% reduction. Gateway ingest throughput rises from 3,032 to 4,185 requests per second. Ingest p99 latency falls from 156ms to 80ms. Peak consumer backlog collapses from 180,953 messages to zero
Read the panels left to right.
Throughput: 40 to 4,185 rows per second. This is the headline, and it is roughly 100x. The writer went from draining slower than the pipeline could fill to draining faster than it. The 70x producer-consumer mismatch from Post 5 inverted: the consumer is now ahead of the producer, which is the only state in which a backlog ever clears.
ClickHouse CPU: 171% to about 15%. This is the one that proves the diagnosis was right. If the CPU had stayed high while throughput rose, the cost would have been raw write volume and batching would only have papered over it. Instead the CPU collapsed by 91%, because the server stopped manufacturing thousands of tiny parts and stopped spending its cores merging them. One part per batch means almost nothing to merge. The 171% was never the data; it was the access pattern, and the access pattern is what changed.
Backlog: 180,953 to 0. Under sustained load the single-row writer let the lag climb to nearly 181,000 messages and kept climbing. The batched writer holds it at zero, because the consumer is now faster than the producer and there is nothing to queue. That flat green line on the drain chart from Post 5 is this number.
The two panels in the middle are the quiet bonus. Gateway ingest throughput rose from 3,032 to 4,185 req/s and p99 latency fell from 156 ms to 80 ms, even though the gateway code did not change at all. This is backpressure relieved. When ClickHouse was choking, the pressure propagated back up the pipeline through the broker and showed up as slower, lower-throughput ingestion. Fix the slowest consumer and the whole pipeline breathes, including stages that were never touched. That coupling, where one slow consumer silently taxes everything upstream, is the subject of the next post.
The three lines of configuration
The entire behavior is governed by three values, and they are externalized on purpose so the batch can be tuned to the hardware without a rebuild. Two of them are injected properties with code defaults; the third is derived from the first.
@Value("${clickhouse.batch-size:500}")             // fill trigger, and the unit of one part
private int batchSize;

@Scheduled(fixedDelayString = "${clickhouse.flush-interval-ms:1000}")  // timer trigger, the latency bound
public void flush() { ... }

int max = batchSize * 4;   // = 2000, the max rows one flush will pull
The defaults live in the code (:500, :1000), so the service runs with no extra config, but either can be overridden by setting clickhouse.batch-size or clickhouse.flush-interval-ms as a Spring property (environment variable or config file) without touching the source.
batch-size is the dial that trades latency for efficiency. Larger batches mean fewer, bigger parts and even less merge work, but more rows waiting in memory and a longer worst-case delay before a row is queryable. Smaller batches mean fresher data and more frequent inserts, drifting back toward the single-row problem if pushed too far. 500 with a 1-second timer is the balance log0 settled on for this workload: large enough that parts are healthy, small enough that a log is visible in ClickHouse within about a second of arriving. The point is that the tradeoff is now a config value that can be moved, not a property baked into the code.
What is not done
- The buffer lives in memory between flushes, and a hard crash loses it. This is the same deliberate tradeoff from post 4, and it is worth restating because it is the cost of this design: rows that are buffered but not yet flushed are gone if the process dies. log0 accepts this because the durable copy stays on the
raw-logstopic, which is replayable. ClickHouse here is analytics storage, not the system of record, so a lost buffer is recoverable by replay and must never block the pipeline. Real tradeoff, chosen on purpose. - A failed batch is dropped, not retried into the buffer. If the batch insert throws a
SQLException, those rows are logged and discarded rather than put back, because requeueing a failing batch risks unbounded memory growth if ClickHouse is down for a stretch. Recovery is araw-logsreplay, which is manual today. The writer stays alive and bounded; it does not self-heal. batch-size = 500is tuned for this single node, not derived. The values were chosen by measurement on one laptop with one ClickHouse node. A different deployment, more cores, faster disk, a multi-node cluster, would want different numbers. The structure, buffer plus dual-trigger flush plus a per-statement cap, transfers; the constants do not.- All numbers are single-node (Docker Desktop, 512 MB per service, single ClickHouse node 24.3, k6, 100 VUs over 60s). The 100x is real and reproducible on this setup; the absolute ceiling would move on bigger hardware. What does not move is the shape: batching a columnar store is a structural win, not a hardware artifact.
Next: post 7, the queue as a shock absorber.. Batching fixed the slow consumer, but it also exposed how the whole pipeline behaves when one stage falls behind: pressure does not vanish, it travels. We will watch a backlog build, drain, and propagate, and look at what a Kafka topic buys you as backpressure between stages that run at different speeds.
Try log0
log0 is the platform this series is built on, an open, multi-tenant incident pipeline you can run yourself or use hosted.
- Platform: log0.in
- Docs: log0.in/docs
- Console: console.log0.in
- charfield, the ASCII animation registry behind the log0 front ends: charfield.log0.in
Written by Ashmit JaiSarita Gupta. Find me on LinkedIn, GitHub, and X, and read the rest of the series on Hashnode.